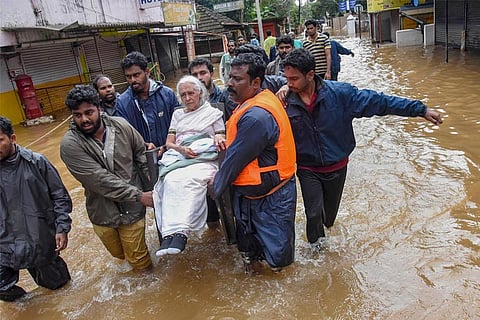
As Kerala is slowly getting back on its feet after the worst floods it has seen in almost a century, Chief Minister Pinarayi Vijayan, on Sunday, said that rebuilding the state will be a mammoth task. More than 300 people have been killed since the monsoons began on May 29. Expressing his gratitude to everybody who has pitched in to rescue those who had been stranded, the Chief Minister said that more than 7,20,000 people have been accommodated in more than 5500 relief camps. And as waters recede, the state gears up for its next challenge - public health and containing any possible outbreak of diseases.
Comparisons have been made to the floods in 1924 (also known as the great flood of ’99) and 1961 in Kerala’s Periyar Basin. And while experts are debating whether the floods were part of a larger cyclical pattern, or climate change, the question is how big was the deluge this year? TNM explains in eight charts how excessive rainfall, and rising water levels in dams caused one of the worst floods in a century.
The monsoon factor
Kerala predominantly gets its rainfall from the South West Monsoon during the months of June to September. The monsoon set in on May 29 this year. Since then, Kerala has received 20911mm of rainfall as on August 15, according to data available with the Regional Meteorological Centre. That’s an excess of 30% this monsoon season.

A comparison of Average rainfall from June 1 to August 20 with the actual rainfall received during the same period.
On the whole, Kerala received excess rainfall in week 2 and week 3 of the monsoon. Districts like Idukki, Palakkad, and Wayanad reported a “large excess” of rainfall between June 7 and June 20, while Malappuram recorded a large excess between June 21 and 27. Kannur, Ernakulam, Kottayam, Kozhikode and Thiruvananthapuram recorded “excess” rainfall in the first couple of weeks, shows data from the Met Dept. While the rainfall for the next two weeks in most districts was reported as normal, there was a spike in the rainfall from Week 7 (July 12 to 18) onwards, with Ernakulam, Idukki, Kottayam, Malappuram recording excess rainfall. Significantly, Palakkad recorded an “excess” of rainfall every week this season, barring week 1.
But it was the week from August 9 to August 15, 2018 that witnessed a huge spike in rainfall – especially for districts like Idukki (70%), Kottayam (41%), Malappuram (40%) and Palakkad (57%).
A table from Indian Meteorological Department showing the excess and deficit rainfall during each week since the onset of South West Monsoon in Kerala.
The dam factor
Due to the unprecedented amount of rainfall received in the state, water levels in dams across the state steadily rose, forcing authorities to open the shutters to discharge water. On August 10, the shutters of Cheruthoni dam in Idukki were opened after 26 years, following huge inflows. The graphs below show how the level of water in five major dams increased from the second half of July, when monsoon grew stronger.
Idamalayar dam in Ernakulam, Idukki dam, Kakki dam in Pathanamthitta and Sholayar dam near Chalakuddy all saw water levels peak in mid-July. Poringal dam in Thrissur alone saw water levels peak in the first half of June.
Water level in Idamalayar dam (in metres).
Water level in Idukki dam (in metres).
Water level in Kakki dam (in metres).
Water level in Poringal dam (in metres).
Water level in Sholayar dam (in metres).
*The water level data for June 29, 2018 is not available in the State Load Despatch Centre website.
People displaced
In terms of destruction, the monsoon has not only killed over 300 people but has displaced over 7.2 lakh people.